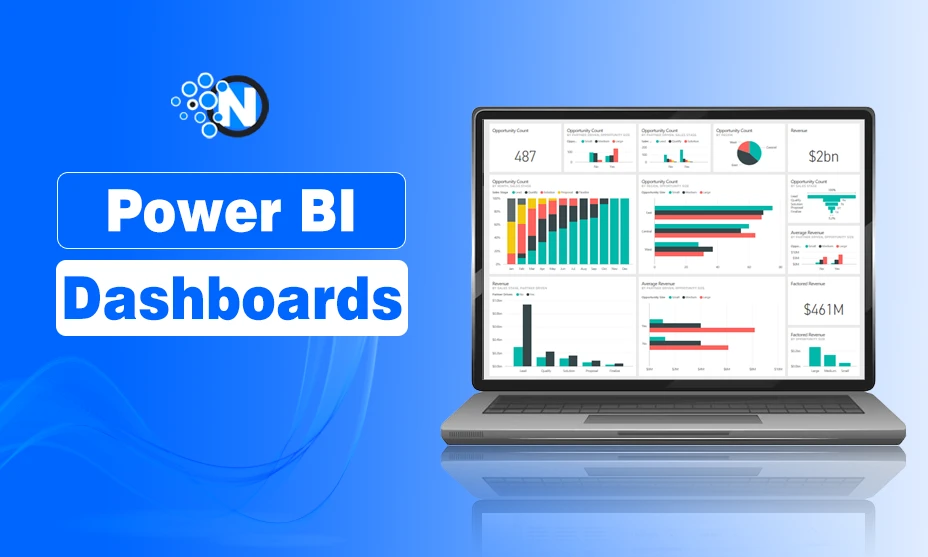
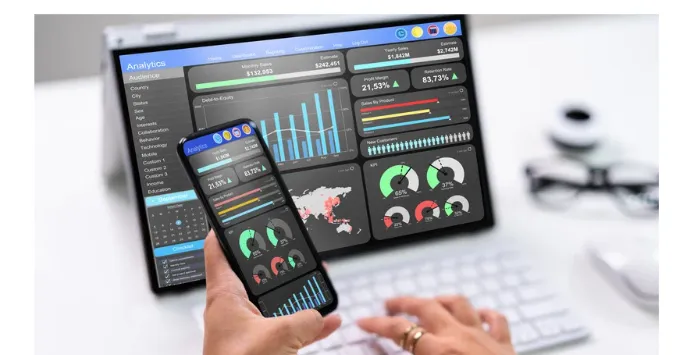
What are Power BI Dashboards? Examples and Use Cases

For companies trying to translate unprocessed data into useful insights, using Business Intelligence (BI) dashboards is useful. Using these dashboards helps businesses simplify their decision-making process, find unspoken patterns, and adjust to always shifting market conditions.
Power BI consulting services are one of the top choices of businesses to access and use these types of dashboards. They provide insights via dynamic charts, graphs, and other visual components catered to different business needs, helping to demystify difficult datasets.
In this article, I’ll be covering the examples and use cases provided by this company. Let’s start.
What are Power BI Dashboards?
Power BI Dashboards are advanced dashboards designed by Power BI consulting services and are helping a lots of businesses.
These dashboards track KPIs, assess performance criteria, and improve operational effectiveness. Eight strong Power BI dashboard examples will be discussed in this post to show how companies may maximize performance and increase development using this tool.

Examples and Use Cases of Power BI Dashboards:
Below are some of the use cases of the Power BI Dashboards that exemplifies the pros and cons of the it.
Dashboard for Sales: A Comprehensive View of Sales Performance
For sales managers, the Sales Dashboard is an indispensable tool providing a complete picture of sales performance. Along with sales by region, it tracks important benchmarks such as annual, quarterly, and monthly sales.
This dashboard is meant to enable managers to spot outstanding teams, products, or areas of performance and make strategic decisions to raise output.
Particularly helpful for identifying underperformance, evaluating team performance, and grasping the elements driving success, this dashboard uses visual elements like donut charts for total sales by marketing channel and area charts for monthly sales trends to help one understand the data.
Use Cases:
- Predict future sales trends using past data and artificial intelligence methods.
- Leaderboards and performance benchmarks help inspire team competitiveness by gamifying sales rep performance.
- Monitoring live data allows one to make quick changes throughout campaigns.
2024’s Trends:
- Embedded analytics let you easily access dashboards included within CRM systems.
- Pay close attention to Customer Lifetime Value (CLV) to evaluate long-term profitability, going beyond transactional measures.
- Mobile-first design: maximize dashboards for mobile use to assist sales staff while traveling.
Dashboard for Marketing Campaigns: Optimize Your Marketing Strategies
The Marketing Campaign Dashboard is your best tool if you wish to evaluate the general effectiveness and return on investment of your marketing plans. This dashboard helps one plan resources and maximize finances by evaluating the performance of various initiatives.
Measuring ROI, conversion rates, and the performance of specific campaigns requires the Marketing Campaign Dashboard. A clear understanding of what works and where changes are required comes from visualizations such as bar charts, pie charts, and heatmaps—showing geographic impact.
Use Cases:
- Attribute Modeling: Find out how well several touchpoints along the consumer journey work.
- A/B testing helps one compare campaign variants to improve tactics.
- Track brand impressions through social media platform data in order to analyze social media sentiment.
2025 Trend Patterns:
- Customized marketing divides groups and crafts messages for maximum involvement.
- Examine campaigns on social media, email, and sponsored ads across channels.
- Data Privacy Compliance: Strict adherence to privacy rules should balance thorough knowledge.
Dashboard for Customer Segmentation: Understand Your Customer Base
Based on demographics, behavior, and preferences, the Customer Segmentation Dashboard helps one grasp and classify clients. Through client segmentation, companies can design customized marketing plans, make products fit for their demands, and strengthen ties with several groups.
Metrics like customer lifetime value (CLV), churn rate, buying trends, and feedback scores—all of which this dashboard shows—are usually employed in the design of focused campaigns and retention strategies by marketing analysts and customer relationship managers.
Use Cases:
- Determine clients most likely to leave and implement active retention strategies.
- Create tailored experiences for different client groups in hyperpersonalizing.
- Suggest best actions for involving particular groups (next best action recommendations).
2025 Trends:
- Segmentation driven by artificial intelligence: hone consumer groupings using machine learning.
- Sentiment analysis helps one understand demands and preferences through consumer comments.
- Track consumer interactions at all touchpoints to create a unified perspective using omnichannel mapping.
Dashboard for Product Sales: Track Product Performance and Channel Success
The Product Sales Dashboard offers information on specific product performance and the sales channels producing outcomes. E-commerce enterprises or companies with several product lines running across different countries would find this dashboard especially useful.
Key elements are heatmaps (for regional performance), dual-axis charts (comparing sales vs. returns), and bar charts indicating sales by product. These components enable companies to maximize inventory, spot quickly sold items, and adjust pricing policies.
Use Cases:
- Based on sales patterns, steer clear of understocking or overstocking inventory.
- Price elasticity analysis helps one better understand how price affects demand for several goods.
- Competitive Benchmarking: Look for opportunities by matching your product performance to that of rivals.
2025 Trends:
- Demand forecasting helps one project future trends and modify output based on them.
- Recommend goods to consumers depending on past purchases driven by artificial intelligence.
- Track and document product environmental impact in terms of sustainability.
Dashboard for Social Media: Maximize Your Social Media Engagement
Over several platforms, the Social Media Dashboard logs engagement, impressions, and performance indicators. It’s meant to enable teams to know which social media platforms generate the most interaction and how best to maximize their content strategies for the greatest effect.
Popular visualizations comprise bar charts (impressions by platform) and ribbon charts (showing impressions over time per platform). These visualizations enable social media managers to enhance their online presence and properly allocate resources.
Use Cases:
- Track rival activities as well as popular subjects in real time.
- Examine the return on investment of influencer relationships.
- Content Performance Optimization: Determine forms and subjects your audience will most relate to.
2025 Trend Patterns:
- Analyze material on sites like Instagram Reels and TikTok for short-form video metrics.
- Community Engagement: Encourage important dialogues with followers.
- Link social data with general marketing dashboards for a complete picture.
HR Dashboard: Manage Workforce Data and Optimize HR Strategies
From employee demographics to performance to retention, the HR Dashboard offers a bird’s-eye view of workforce data. Using this dashboard, HR managers spot patterns and handle issues, including skill shortages or turnover.
Important benchmarks include diversity statistics, average pay, and average tenure. Area charts (new recruits by year), bar charts (workers by region), and KPIs—such as average age—often abound on this dashboard.
Use Cases:
- Track diversity in inclusion efforts.
- Analyze feedback to improve job satisfaction.
- Analyze skills gaps to help staff members become more competent.
2025 Trend Patterns:
- Track performance in hybrid workplaces with remote work analytics.
- Predictive models help maximize talent acquisition driven by artificial intelligence.
- Retention Strategies: Execute evidence-based projects to lower turnover.
Email Engagement Dashboard:
The Email Engagement Analytics Dashboard assesses email campaign success. Track delivery rates, open rates, click-through rates, and bounce rates to help businesses hone their plans.
Actionable insights abound from visualizations including pie charts (bounce distribution) and line charts (email patterns over time).
Use Cases:
- Determine the best time to approach audiences.
- Craft better subject lines using A/B testing.
- Customized campaigns allow material to fit subscriber tastes.
2025 Trend Patterns:
- Interactive emails could feature quizzes or polls to increase participation.
- Create custom emails with AI tools.
- Privacy-Based Marketing: Prioritize data security and recipient permission.
Dashboard for Finances:
The Finance Dashboard provides a thorough financial health analysis of a company. Tracking income, expenses, and cash flow helps finance teams make wise decisions.
Key visualizations include dual-axis charts (highlighting over- and underperformance), pie charts (spending categories), and waterfall charts (summarizing expenditures and income).
Use Cases:
- Plan future inflows and outflows in your cash flow forecasting.
- Data analysis helps you reduce financial risks.
- Comparing actuals to budgets helps one find differences in budgets.
2025 Trends:
- Ensure interested parties have access to the most recent financial data.
- Blockchain technologies improve transaction transparency and security.
- Combine social and environmental performance indicators with financial data in ESG Metrics Integration.
The Finale:
Power BI consulting services can assist companies in fully utilizing their enormous data collection capacity. Power BI dashboards enable companies to make data-driven decisions, increase performance, and stay ahead of the curve from sales and marketing to HR and finance. Use these tools to turn your information into a growth and success accelerator.


