Managing IT operations today is not what it used to be. With hybrid infrastructures, cloud-native environments, and the pressure to reduce downtime, things can get complicated fast. That’s where OpsRamp comes in.
I have been exploring this platform, and if you are someone who juggles multiple IT tools or struggles to keep your infrastructure running smoothly, you might want to pay attention.
OpsRamp promises to simplify everything from infrastructure monitoring to incident resolution. In this review, I will walk you through how it works, what it offers, and why it might be the right solution for your IT operations.
What is OpsRamp?
OpsRamp is a modern IT operations management (ITOM) platform designed to help enterprises gain better visibility, control, and automation across hybrid infrastructure.
Whether your systems are on-premises, in the cloud, or a mix of both, OpsRamp lets you manage them from a single pane of glass and serves as the top automation tools for businesses.
It is not just about monitoring – it is about intelligently identifying issues, automating responses, and making IT ops teams more efficient. If you have ever found yourself drowning in alerts, manually juggling tickets, or switching between too many tools, OpsRamp offers a much-needed sense of control.
Key Features of OpsRamp
Before we go deeper into the benefits, it is important to understand what OpsRamp actually brings to the table. Each feature is crafted to help IT teams respond faster, reduce manual workload, and operate at scale with confidence.
1. Unified IT Monitoring
With OpsRamp, you can monitor your entire infrastructure such as servers, network devices, applications, cloud services – all in one place. I found the interface surprisingly clean and intuitive.
Instead of hopping between tools, everything you need is right in front of you. And the best part? It supports multi-cloud environments, including AWS, Azure, and Google Cloud.
2. Event Correlation and Noise Reduction
If you are tired of being bombarded by alerts, you are going to appreciate this. OpsRamp uses machine learning to detect patterns and correlate related events. This drastically reduces alert noise.
You only get notified when it matters, which helps your team focus on real issues rather than false alarms.
3. Intelligent Incident Management
When something breaks, every second counts. OpsRamp automates incident detection and integrates with your service desk (like ServiceNow or Jira) to open, escalate, and even resolve tickets.
You can set up playbooks to handle recurring issues automatically, which save your team loads of time.
4. Automated Discovery and Dependency Mapping
You can’t manage what you don’t see. OpsRamp automatically discovers resources across your environment and maps their dependencies.
This visual mapping helps you quickly identify which systems are affected during an outage to speed up root cause analysis.
5. Service-Centric Visibility
Instead of focusing just on infrastructure, OpsRamp organizes your view around services. This means you can see how infrastructure health impacts business services. It is a game changer if your goal is to align IT with business outcomes.
6. AIOps Capabilities
Artificial Intelligence for IT Operations is not just a buzzword here. OpsRamp’s AIOps engine helps with anomaly detection, predictive insights, and proactive incident management. It is like having an extra team member watching over your operations 24/7.
Benefits of Using OpsRamp
Now that we have looked at the features, let’s talk about how they translate into real world benefits. This is where OpsRamp really starts to shine.
1. Enhanced Visibility Across Hybrid Environments
One of the biggest challenges in modern IT is managing hybrid infrastructure. OpsRamp brings everything together in a single dashboard.
I have seen how this kind of visibility improves decision-making and helps avoid blind spots, especially when managing distributed environments.
2. Reduced Mean Time to Resolution (MTTR)
Because of the automation and intelligent alerting, your team does not waste time chasing false alarms or figuring out what’s wrong.
Incidents are detected earlier, routed faster, and resolved with less manual work. This means less downtime and happier end users.
3. Lower Operational Costs
With automation handling repetitive tasks and fewer tools to manage, your team spends less time on maintenance and more on innovation. That directly translates to cost savings.
Plus, the ability to proactively prevent outages means you are avoiding expensive downtime.
4. Better Collaboration Between Teams
When developers, IT ops, and business stakeholders are all looking at the same data and service maps, collaboration becomes smoother.
OpsRamp creates a shared context, so everyone is on the same page when solving problems or planning upgrades.
5. Scalable for Enterprise Needs
Whether you are managing 100 or 10,000 devices, OpsRamp scales easily. I think that makes it a solid choice not just for big enterprises.
But for growing companies planning to expand their IT footprint.
Is Using OpsRamp Worth it?
I have reviewed a lot of IT management tools over time, and what sets OpsRamp apart is how intelligently it ties everything together.
You do not just get raw data – you get actionable insights. You don’t just manage alerts – you manage services. And you don’t just react – you prevent.
If you are running a large, complex infrastructure or preparing to scale, OpsRamp can be that central nervous system that keeps everything running smoothly.
It is especially useful for IT teams that are stretched thin and need to do more with less.
How to Use OpsRamp?
If you are new to OpsRamp and wondering how to get started, don’t worry. I have broken down the steps into a clear and simple flow. You don’t need to be a tech wizard to get this running.
Just follow the steps and you will be managing and monitoring your infrastructure in no time.
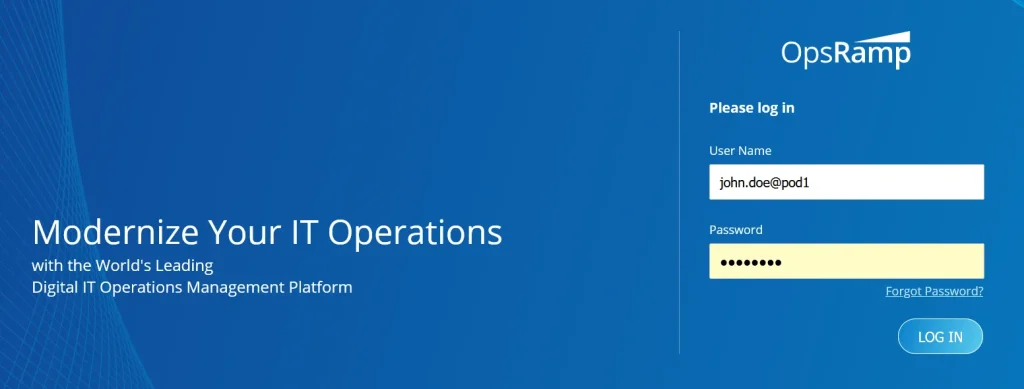
Step 1: Log in to Your OpsRamp Account
To begin, you need access to the OpsRamp portal. Your organization should have received credentials. Once you have got those:
- Head over to https://{your-org-name}.app.opsramp.com
- Enter your login details as a Partner Administrator
- Click Log In
- And just like that, you are in.
Step 2: Create a Client Account
OpsRamp is built on a multi-tenant model, so you will first create what is called a “Client Account.” This is essentially where your monitoring setup begins.
- Go to Setup > Accounts > Clients
- Click on +Add
- Fill in the details like client name, address, country, and time zone
- Set Auto Monitoring Resources to No (recommended for manual configuration)
- Click Next, then Finish
Now, you have set up a space where all monitoring, alerts, and data will be neatly organized.
Step 3: Install the OpsRamp Agent
The agent is a lightweight piece of software you install on your servers or virtual machines. It is the bridge that connects your IT environment to OpsRamp.
- Go to Setup, then Account, and Integrations
- Choose your operating system (Windows or Linux)
- Follow the instructions to install the agent
- Once done, go to Infrastructure > Resources > Server to confirm the installation
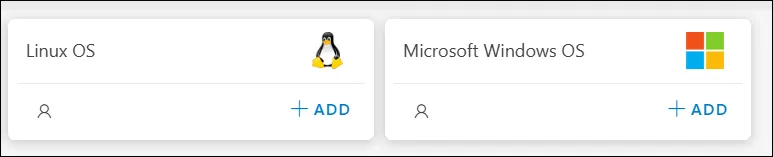
Without the agent, OpsRamp can not really monitor what is going on – so this step is a must.
Step 4: Set Up Monitoring
Now that the agent is installed, it is time to tell OpsRamp what to monitor. This is where monitoring templates come in handy.
- These templates are pre-configured settings that track specific metrics like CPU usage, memory load, network traffic, etc.
- You can apply templates based on your server type and requirements
- You can also customize thresholds so that alerts only trigger when something truly needs your attention
Monitoring is where the magic starts to happen – now OpsRamp knows what to watch out for.
Step 5: View Dashboards
This is your command center. Dashboards in OpsRamp show you real time data about your infrastructure.
- Navigate to Dashboards and then go to Dashboards 2.0
- Here, you will see widgets that reflect server health, performance, and availability
- You can customize your dashboard or stick with the default view – it is up to you
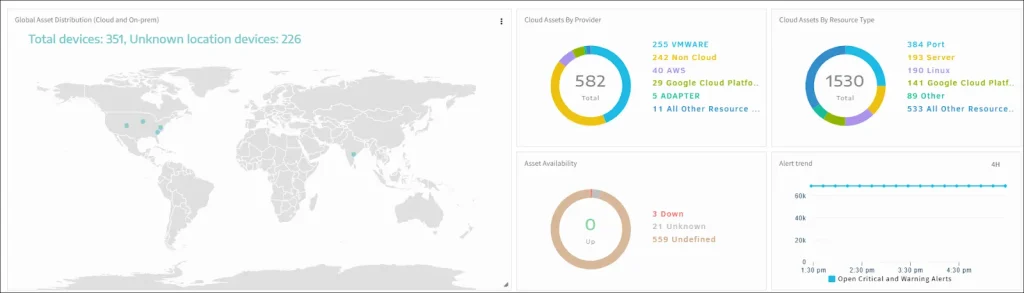
This gives you a visual summary of how everything is doing.
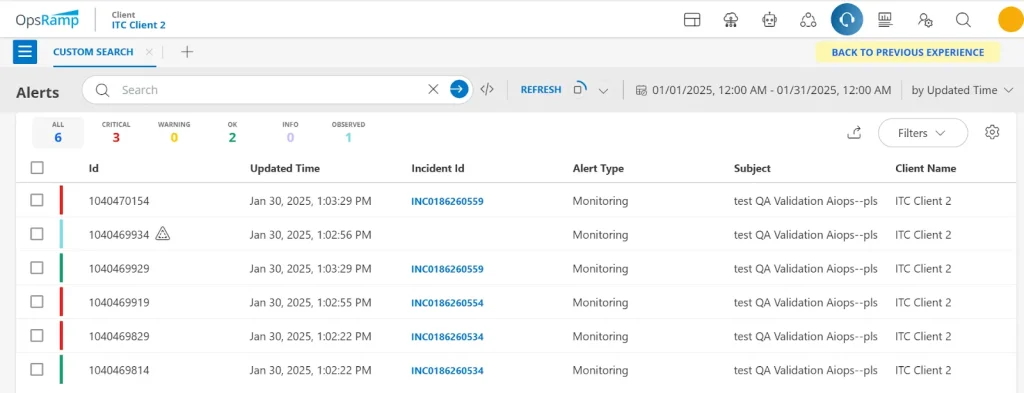
Step 6: Monitor Alerts
To check if everything is working including servers, you can even simulate an alert.
- Power off your server temporarily
- Go to Command Center and then Alerts
- You will see a “Critical” alert appear
- Once you power the server back on, the alert status will change to “OK”
This alerting system helps you stay ahead of problems before they become disasters.
OpsRamp Pricing Plans – How Much Does it Cost?
OpsRamp follows the pay as you go model which means you have to contact the support to find the customized pricing plans according to your needs and requirements.
I personally like this aspect as you do not have to pay for the features which are non functional for you. In this way, you can significantly reduces your cost and expenditures.
Top 5 Best OpsRamp Alternatives
Although OpsRamp is one of the highly functional IT management tools, some people dislike it for different reasons including ease of use, features, and system requirements.
That’s why I have mentioned the top 5 alternatives to OpsRamp which you can also explore for better results. Whether you are just comparing features or seriously considering a switch, this will give you a quick and clear idea of what each one offers.
1. DataDog
If you have ever looked into observability tools, you have probably heard of DataDog. It is a cloud based platform that brings infrastructure monitoring, application performance monitoring (APM), log management, and security under one roof.
I really like how easy it is to plug into just about any stack – whether you are running on AWS, Azure, Kubernetes, or even a legacy system. Therefore, I have mentioned it among the best OpsRamp alternatives.
Pros
- User friendly dashboards: Super intuitive and visually rich dashboards make it easy to spot issues fast.
- Great integrations: Supports 600+ integrations, so it likely works with what you are already using.
- Real time performance insights: Get instant metrics across your apps and infra.
- Efficient log management: Search and analyze logs right alongside your metrics.
- AI powered alerting: Helps reduce noise and surface the alerts that actually matter.
Cons
- Pricing can escalate quickly: As your monitoring needs grow, so does your bill. Not always friendly for startups.
2. Dynatrace
Dynatrace is another name among the top sites like OpsRamp and is a powerful player in the observability space. It is well known for its AI-driven monitoring capabilities and automatic discovery features.
What really stands out to me is how deeply it analyzes application behavior – it can even trace code.level performance issues without you lifting a finger.
Pros
- AI engine (Davis): Automatically identifies root causes and cuts through alert noise.
- Full stack observability: Monitors everything from user experience to the backend code.
- Auto discovery: Instantly maps your entire environment – no manual config needed.
- Smart automation: Easily integrates with CI/CD tools to automate workflows.
- Strong security monitoring: Gives you visibility into vulnerabilities and misconfigurations.
Cons
- Learning curve is steep: It is super powerful, but the interface and depth can overwhelm new users.
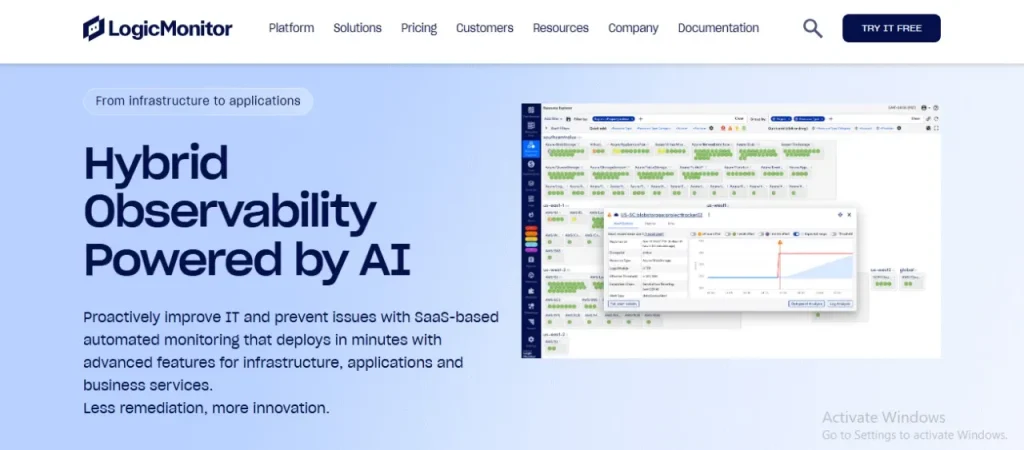
3. LogicMonitor
LogicMonitor is a fully automated SaaS based performance monitoring platform built for IT operations and cloud infrastructure.
What I love is its focus on simplicity and how quickly you can go from zero to full visibility which makes it one of the best OpsRamp competitors.
Pros
- Quick setup: You can start monitoring in minutes, no complicated installs.
- Cloud first mindset: Works really well for hybrid and multi cloud environments.
- Intelligent alerts: Cuts down on noise and only notifies you about important stuff.
- Custom dashboards: Drag and drop widgets let you build views tailored to your needs.
- Scalable for enterprises: Easily handles large environments without performance drops.
Cons
- Limited out of the box integrations compared to others: It has a lot, but still lags behind tools like DataDog.
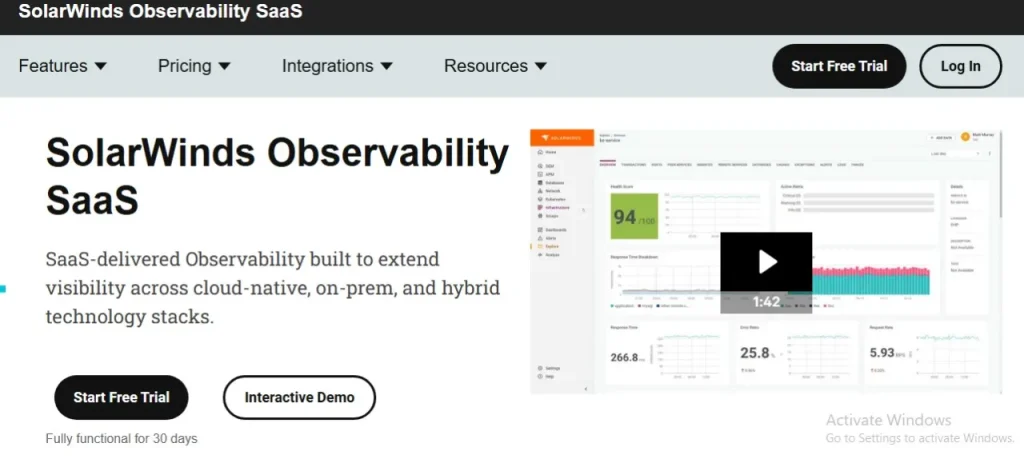
4. SolarWinds Observability
SolarWinds Observability is part of their evolution into modern, cloud native monitoring and is considered one of the best alternatives to OpsRamp. It is designed to provide a unified view of applications, infrastructure, and network performance. If you are already a SolarWinds user, this transition feels very natural.
Pros
- Single pane of glass monitoring: See your entire tech stack from one clean interface.
- App centric visibility: Pinpoints performance issues across app layers fast.
- Smart troubleshooting tools: Helps isolate root causes quickly.
- Affordable pricing tiers: Offers good value for mid sized businesses.
- Easy cloud migration tracking: Great for monitoring hybrid environments.
Cons
- Reputation baggage: SolarWinds has had past security concerns, which some organizations are still cautious about.
5. New Relic
Lastly, I am going with New Relic in this rundown on the best OpsRamp alternatives. It is another crowd favorite when it comes to end to end observability. It is built for developers, SREs, and IT teams who want complete control over app and infrastructure data.
One thing I really admire is their “everything included” pricing model – you get full stack monitoring for one flat rate.
Pros
- One user, one price: Simple, transparent pricing for all features.
- Open telemetry support: Plays well with modern observability standards.
- Detailed performance breakdowns: Helps developers quickly diagnose bottlenecks.
- Unified view: Logs, metrics, and traces all in one place.
- Customizable alerts: Flexible setup lets you dial alerts exactly how you want.
Cons
- Initial setup can be complex: Especially if you are not familiar with telemetry standards or agent installations.
Final Thoughts
At the end of the day, IT operations is all about keeping systems running, users happy, and costs in check. OpsRamp helps you achieve that by centralizing control, adding intelligence to your operations, and making your team more efficient.
Whether you are drowning in alerts, struggling with cloud complexity, or just need better visibility, OpsRamp offers a real, practical solution. I genuinely think it is worth exploring if your current toolset feels disjointed or outdated.
Try the demo, play around with its automation tools, and see if it fits your workflow.