Best Instagram Infographic Ideas to Boost Engagement in 2026
From my own experience on Instagram, plain posts don’t stop the scroll anymore—but infographics still do. They’re quick to read, easy to save, and simple to share, which makes them consistently effective.
As attention spans shrink and competition grows, infographics enable creators and brands grow their social media profiles and align with the latest Instagram marketing trends.
A strong infographic doesn’t just inform—it gets people to pause, swipe through, save it, and come back later.
Whether you’re building authority, driving engagement, or growing your social media platform for business, the right infographic format can make a real difference. In this guide, I’ve shared Instagram infographic ideas that actually work in 2026.
Best Instagram Infographics That Go Viral
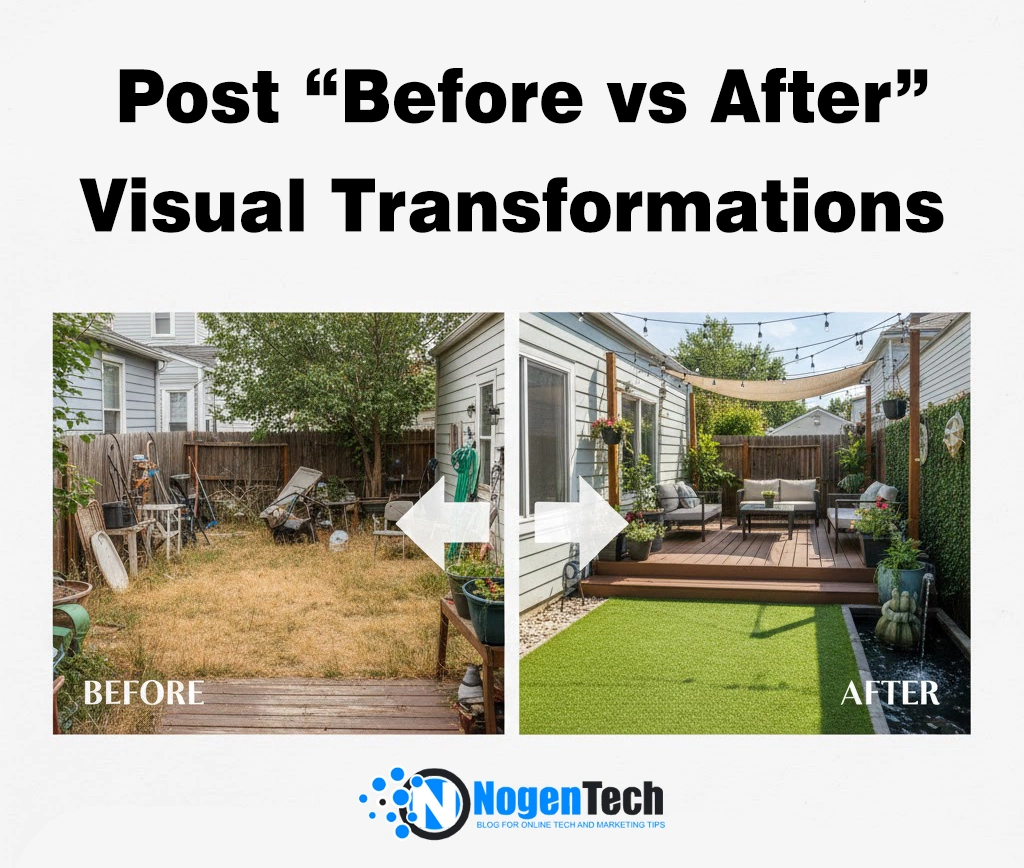
1. Post “Before vs After” Visual Transformations
From my experience, “Before vs After” posts are instant scroll-stoppers. People can’t resist seeing progress, whether it’s a habit, a fitness journey, or even an editing style. Some ideas that work well:
- Before vs After habits
- Before vs After editing styles
- Before vs After fitness changes
- Before vs After Mindset Shifts
Why it works:
Visual progress is emotional, relatable, and highly shareable—perfect for carousel infographics.
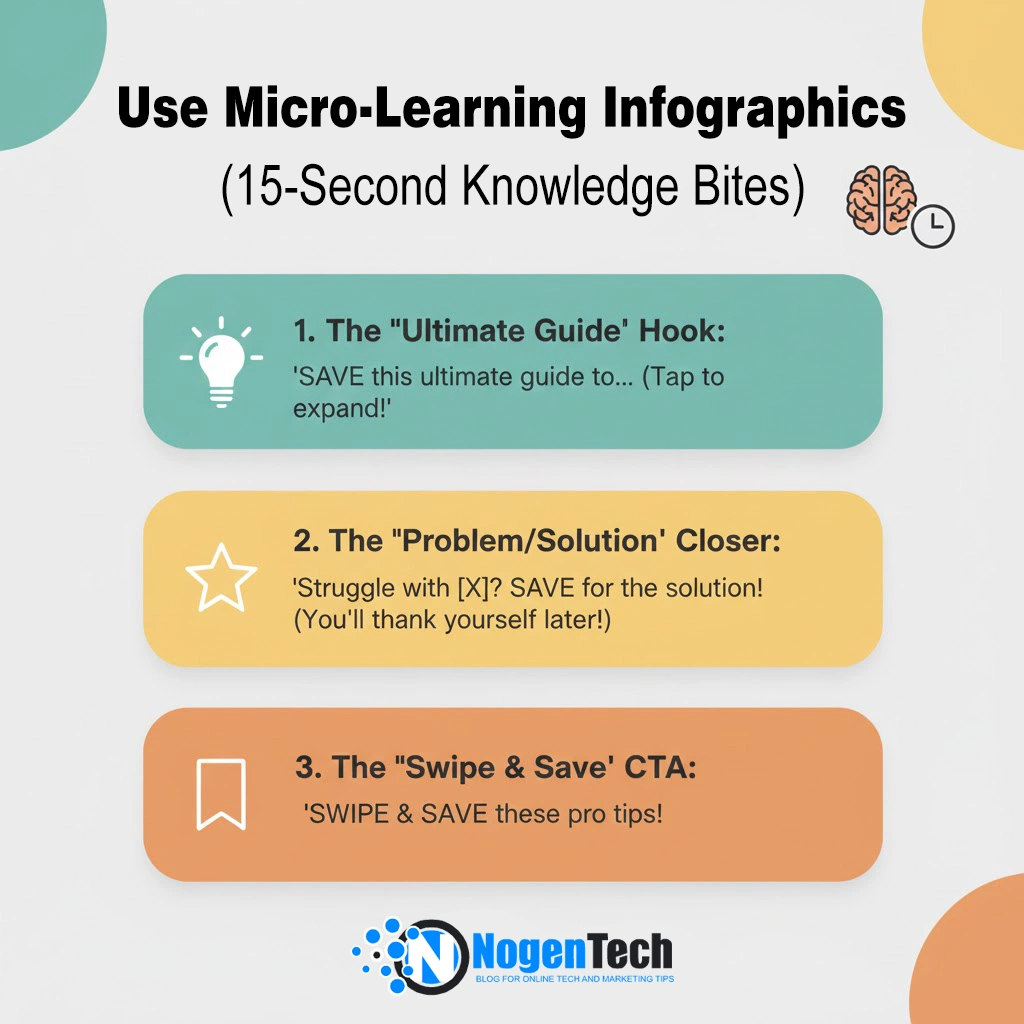
2. Use Micro-Learning Infographics (15-Second Knowledge Bites)
People scroll fast, and long posts often get ignored. Micro-learning infographics—quick, swipeable lessons—let you share knowledge instantly. Artificial Intelligence and smart designs make it easy to turn big topics into crisp, digestible bites.
Examples:
- “5 Psychology Tricks for Better Conversations”
- “A 10-Second Guide to Aesthetic Color Palettes”
- “3 Captions That Get More Saves”
Why it works:
In 2026, short attention spans rule. Bite-sized info is shareable, saveable, and visually engaging, especially to make your content pop.
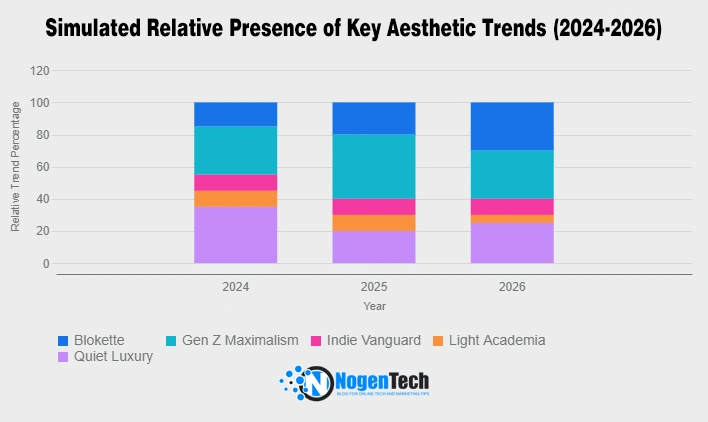
3. Trend Prediction Infographics (High Shareability)
People stop scrolling for Instagram infographics that show what’s coming next. Future-focused content—trends, predictions, or forecasts—gets shared, saved, and discussed, boosting engagement.
Try formats like:
- “2026 Aesthetic Trends You’ll See Everywhere”
- “2026 Marketing Predictions”
- “The Future of Content Creation: What’s Next?”
Why it works:
Predictive content positions you as an expert and encourages saves. Pair this with marketing trends to create authoritative, shareable posts that keep your audience coming back for more.
4. Creator Toolkit Infographics
Creators love anything that makes their workflow easier, such as editing tools and AI software. Infographics that highlight resources, guides, or templates get instant shares because they provide real value.
Examples:
- “Best Tools for Creators in 2026”
- “Apps That Make Editing 5x Faster”
- “Apps for Creating Beautiful Instagram Stories”
Why it works:
People save and share these posts immediately—they help others work smarter, not harder, while building your authority as a go-to resource.
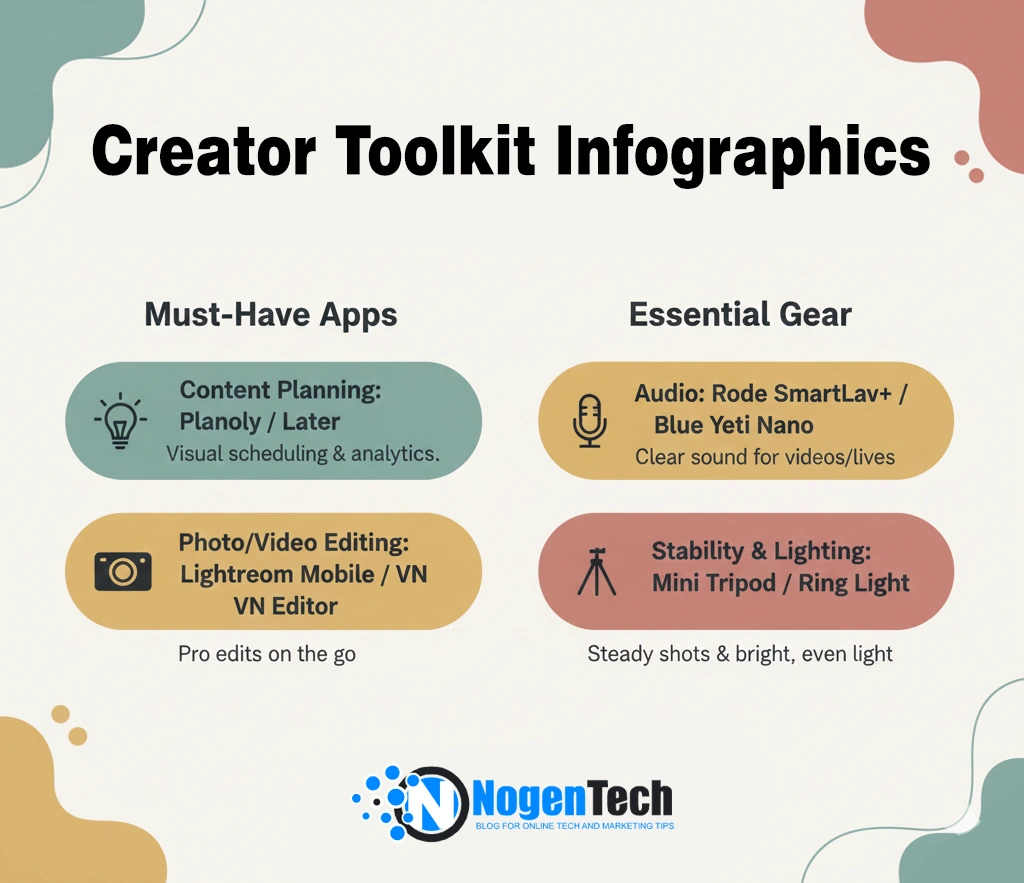
👉 Pro Tip: This format goes viral in creator communities.
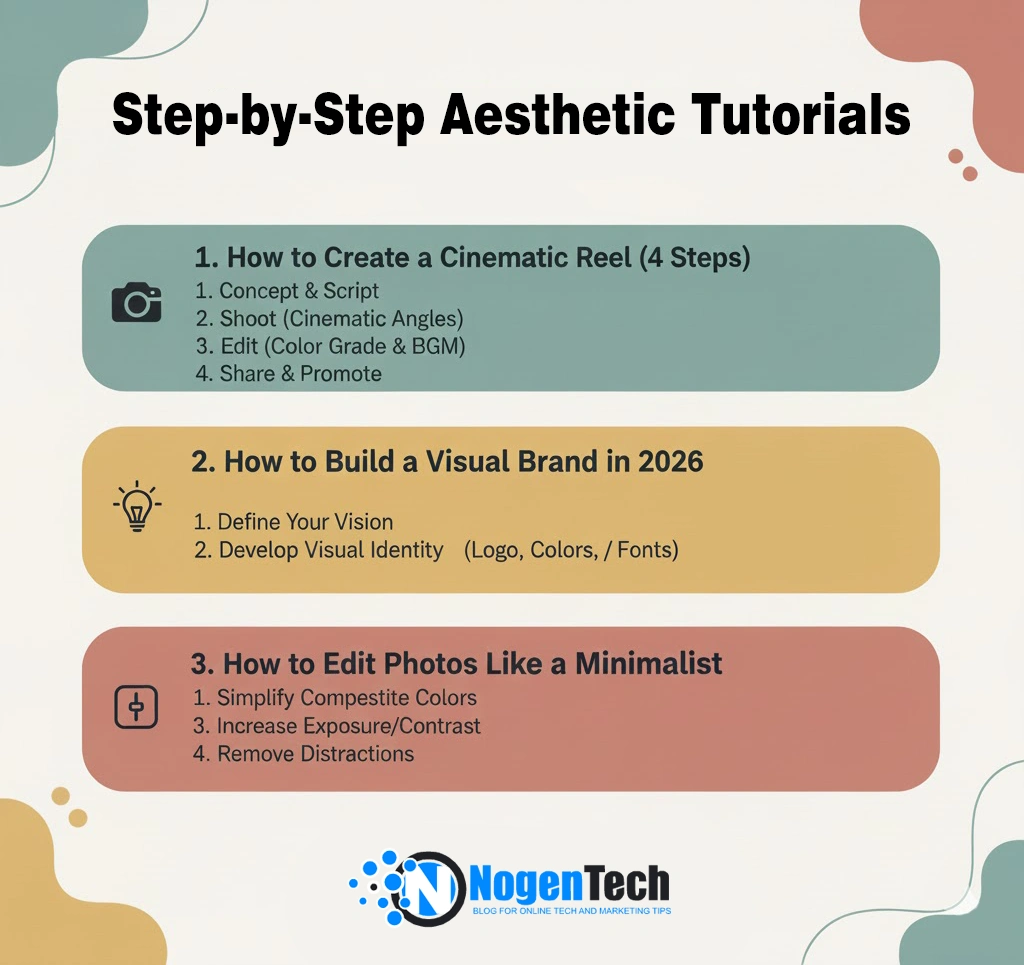
5. Step-by-Step Aesthetic Tutorials
People love learning directly from creators who show them how to do something innovative. Infographics that act as mini-tutorials or step-by-step guides build engagement and strengthen your relationship with viewers.
Examples:
- “How to Create a Cinematic Reel (4 Steps)”
- “How to Build Brand Trust on Social Media”
- “How to Edit Photos Like a Minimalist”
Why it works:
Tutorial carousels get saved and shared the most because they give beginners actionable steps. You can also use Instagram highlights to showcase your guides permanently.
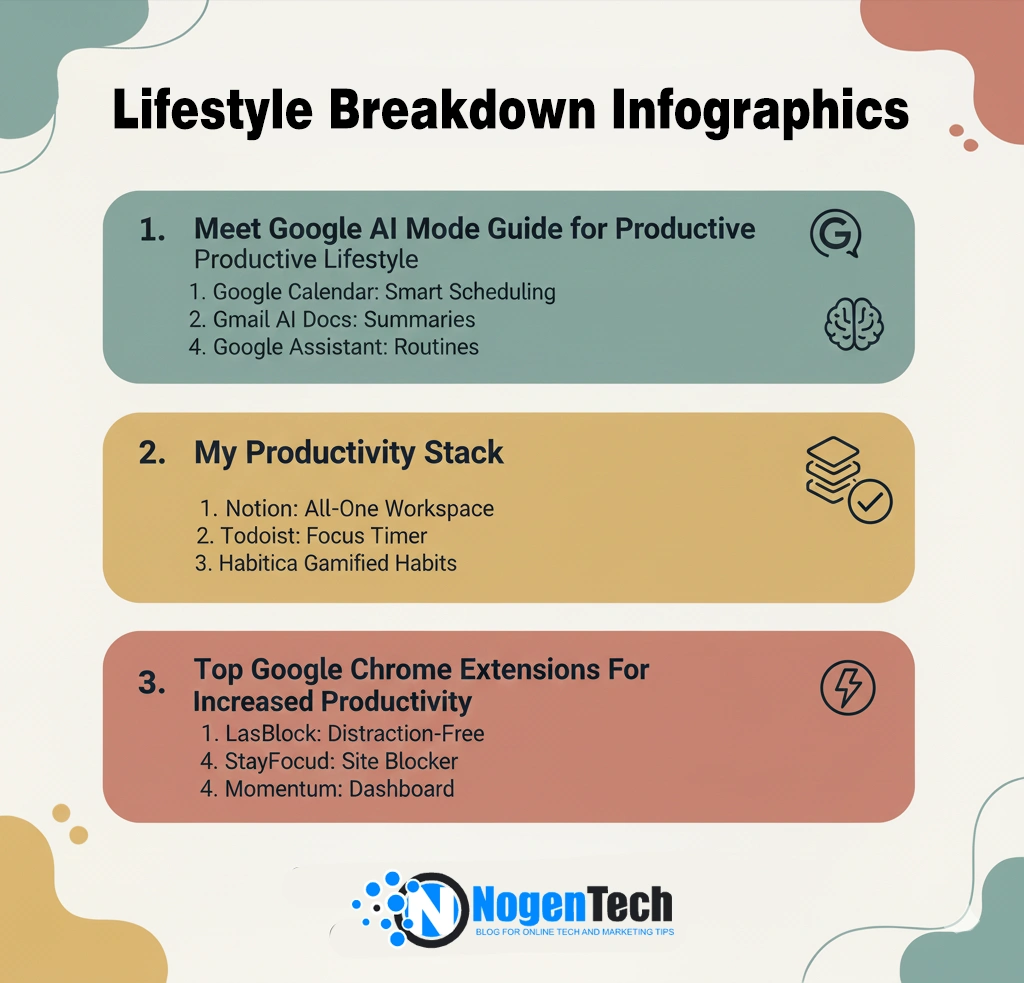
6. Lifestyle Breakdown Infographics (Highly Relatable)
Lifestyle infographics always perform well because they simplify life, solve daily problems, and make routines feel achievable.
They connect with a universal desire for balance, productivity, and self-improvement.
Try:
- “Meet Google AI Mode Guide for Productive Lifestyle”
- “My Productivity Stack”
- “Top Google Chrome Extensions For Increased Productivity”
Why it works:
People love frameworks that feel achievable and help them get the most out of their daily life routines.
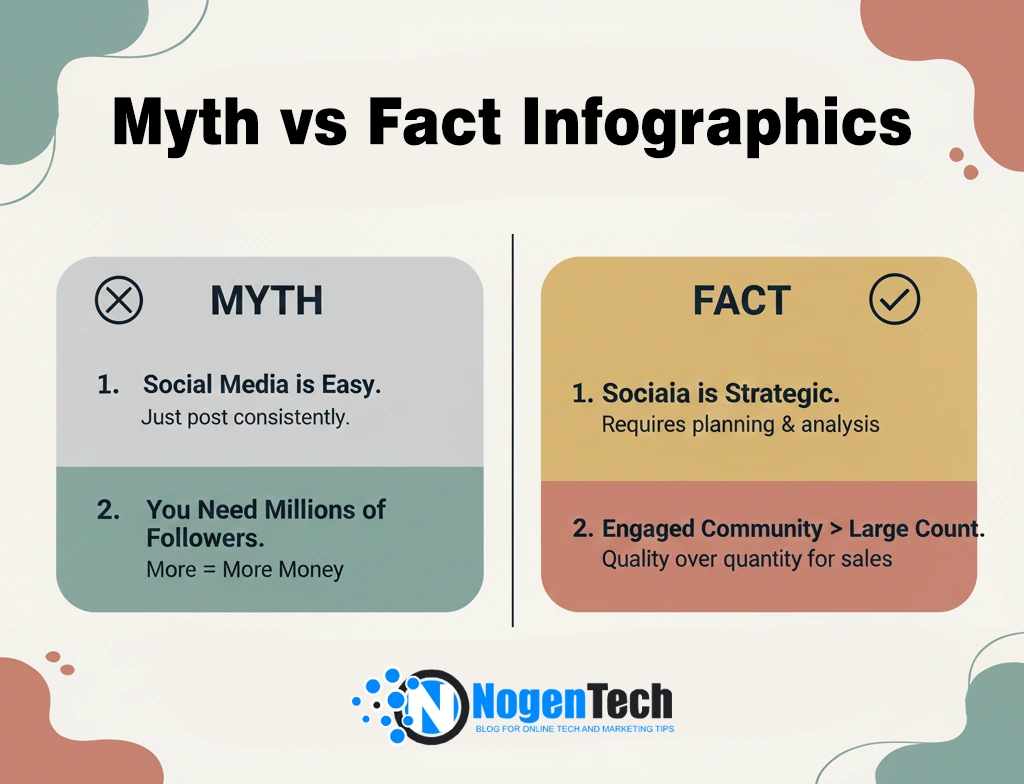
7. Myth vs Fact Infographics (Perfect for Experts)
Myth vs Fact infographics are a top-performing format on Instagram, and in 2026, they’re bigger than ever. People love challenging what they think they know—myths spark curiosity, facts bring clarity.
Examples:
Why it works:
Myth-busting drives comments, debates, and shares.
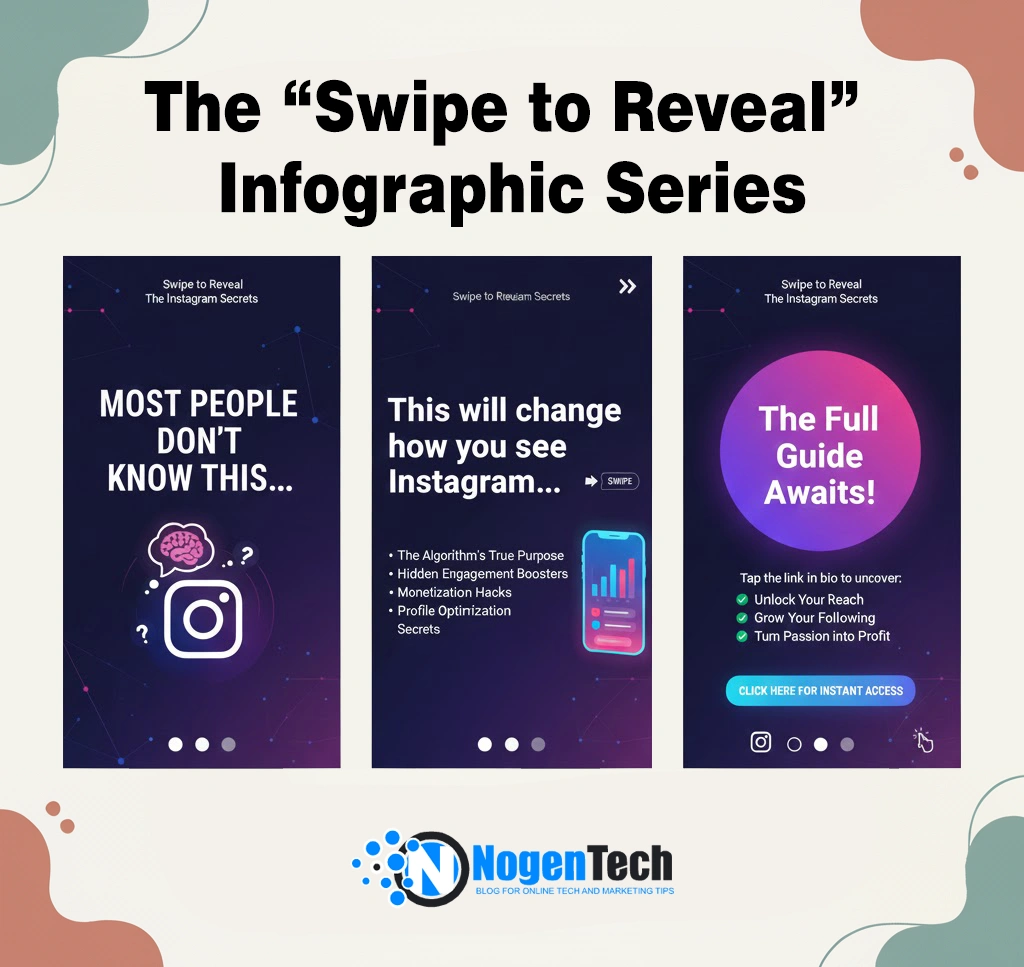
8. The “Swipe to Reveal” Infographic Series
If there’s one infographic format that’s built perfectly for the 2026 Instagram algorithm, it’s the Swipe to Reveal series. Instagram loves content that keeps people swiping through every slide, and this format does exactly that.
It taps into curiosity, suspense, emotional payoff, and the human need to “solve the mystery.”
- “Most people don’t know this…”
- “This will change how you see Instagram…”
Then reveal answers, tips, or secrets across the next slides.
Why it works:
Triggers curiosity → keeps people swiping → boosts reach.
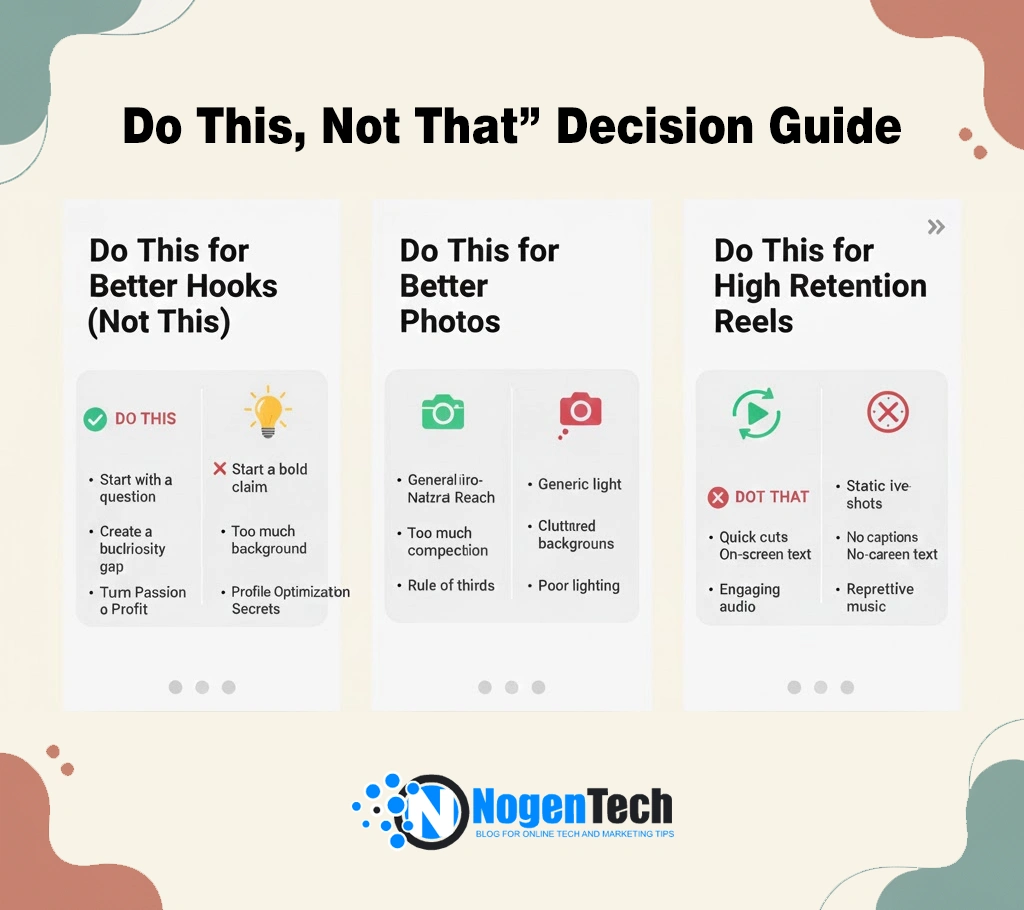
9. “Do This, Not That” Decision Guide
If there’s one infographic style creators can’t resist saving, it’s the “Do This, Not That” guide.
Simple, practical, and clear, it instantly helps people make better decisions in just one swipe. This format removes confusion and shows exactly what to do versus what to avoid.
Examples:
- “Do This for Better Hooks (Not This)”
- “Do This for Better Photos”
- “Do This for High Retention Reels”
Why it works:
Easy to read. Easy to share. And easy to implement.
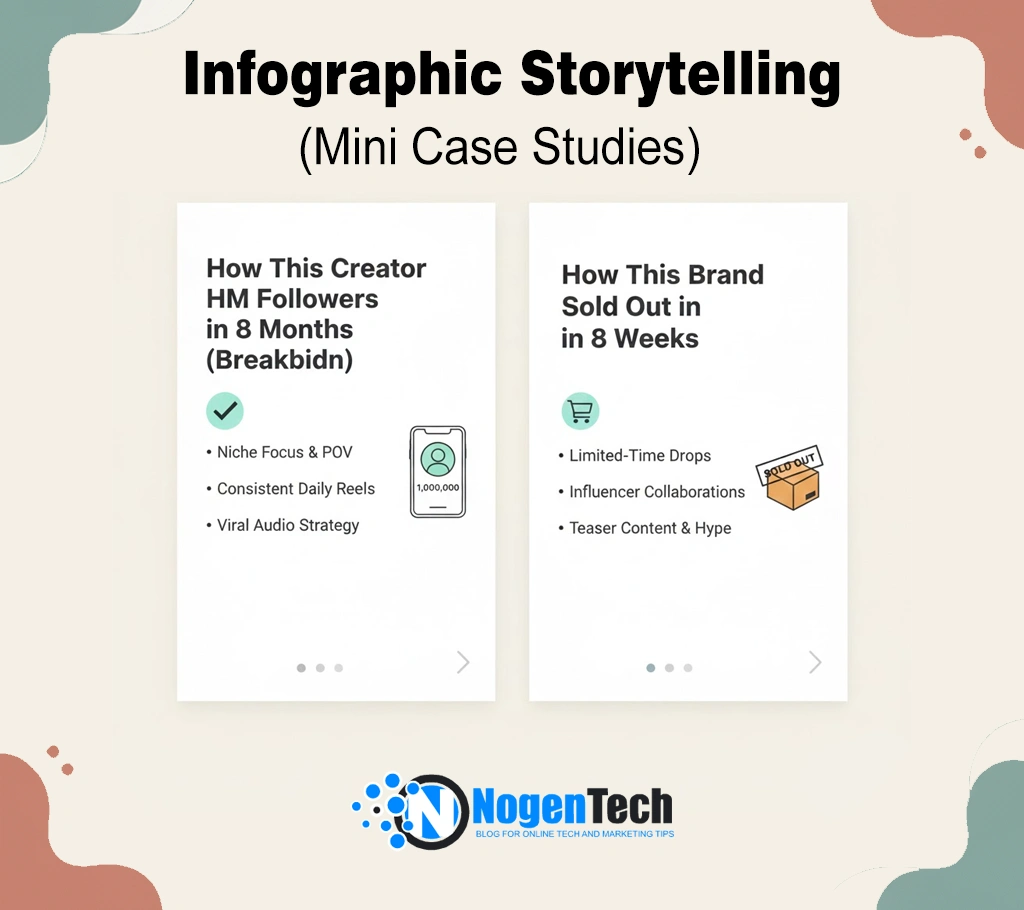
10. Infographic Storytelling (Mini Case Studies)
Instagram Stories are one of the most engaging ways to teach, and on Instagram, they work even better as visual, infographic-style lessons.
Instead of just sharing facts, you guide your audience through a narrative, giving context, insight, and a takeaway in a swipeable format.
Example:
- “How This Creator Hit 1M Followers in 8 Months (Breakdown)”
- “How This Brand Sold Out in 2 Weeks”
Why it works:
People love story-based value; they stay longer, swipe more, and save it. For more inspiration on creating standout visuals, you can also check out various apps for creating beautiful Instagram stories.
Make Your Infographics Work for You
Personally, I’ve found that infographics are the secret weapon for growing an Instagram account. They combine value, clarity, and shareability in a way plain posts never do.
When done right, they stop the scroll, spark engagement, and keep your audience coming back for more.
Pro Tip for 2026:
To maximize the impact of your infographics:
1. Mix educational, inspirational, and entertaining content.
2. Keep visual hierarchy and typography clean for quick comprehension.
3. Incorporate micro-interactions like prompts to comment, save, or screenshot.
4. Test carousel lengths to see what keeps your audience swiping.
In 2026, the right Instagram infographic is more than a visual and a growth engine. It builds authority, drives engagement, and boosts trust, all in one scrollable package.
People Also Ask
What are Instagram infographics?
Instagram infographics are visually structured posts that combine graphics, icons, charts, and minimal text to present information, tips, tutorials, or statistics in a digestible and engaging format.
How do I make an Instagram infographic that goes viral?
To maximize virality:
- End with a CTA encouraging comments, saves, or shares.
- Use a strong hook in the first slide.
- Keep visuals clean, bold, and consistent.
- Include actionable tips or insights.
- Incorporate interactive elements like swipe-to-reveal or “Do This, Not That” formats.
How many slides should a carousel infographic have?
For engagement in 2026:
- 3–7 slides: Quick tips or small updates
- 8–15 slides: Step-by-step guides, case studies, or storytelling
- 15+ slides: Long-form tutorials or deep-dive breakdowns
Focus on keeping each slide concise and visually appealing.
Can infographics improve Instagram saves and shares?
Yes! Infographics are designed to deliver high-value, easy-to-digest content, which encourages users to save them for later reference and share them with friends.